[Edited by Antonello Mori]
The ontologically schematic nature of the avvisi produced by Amerigo Salvetti lends itself well to the numerous opportunities offered by digital humanities tools. In this case, the documentary corpus of 1641 was examined in order to carry out a social network analysis of the protagonists of the documentation, after appropriate XML coding[1]. In fact, the chosen year is not random. 1641 encapsulates all the tensions that will later erupt in the so-called First English Civil War. The aim of the analysis is to demonstrate how documentation can be used to capture and highlight the protagonists and the relationships they had with each other and their respective factions well before the conflict broke out, thus anticipating the alliances that were formed during the war.
To conduct the analysis, the principle was defined that for each news item, the character or characters involved would be considered only when they act or undergo an action within the narrated episode. The operation was delicate, as it was not uncommon to find narratives in which characters who seemed to play a concrete role were mentioned, but in the end, they turned out to be completely marginal or simply mentioned. Furthermore, it was decided that when two characters are present in a news item and interact with the event or each other, they are connected to each other.
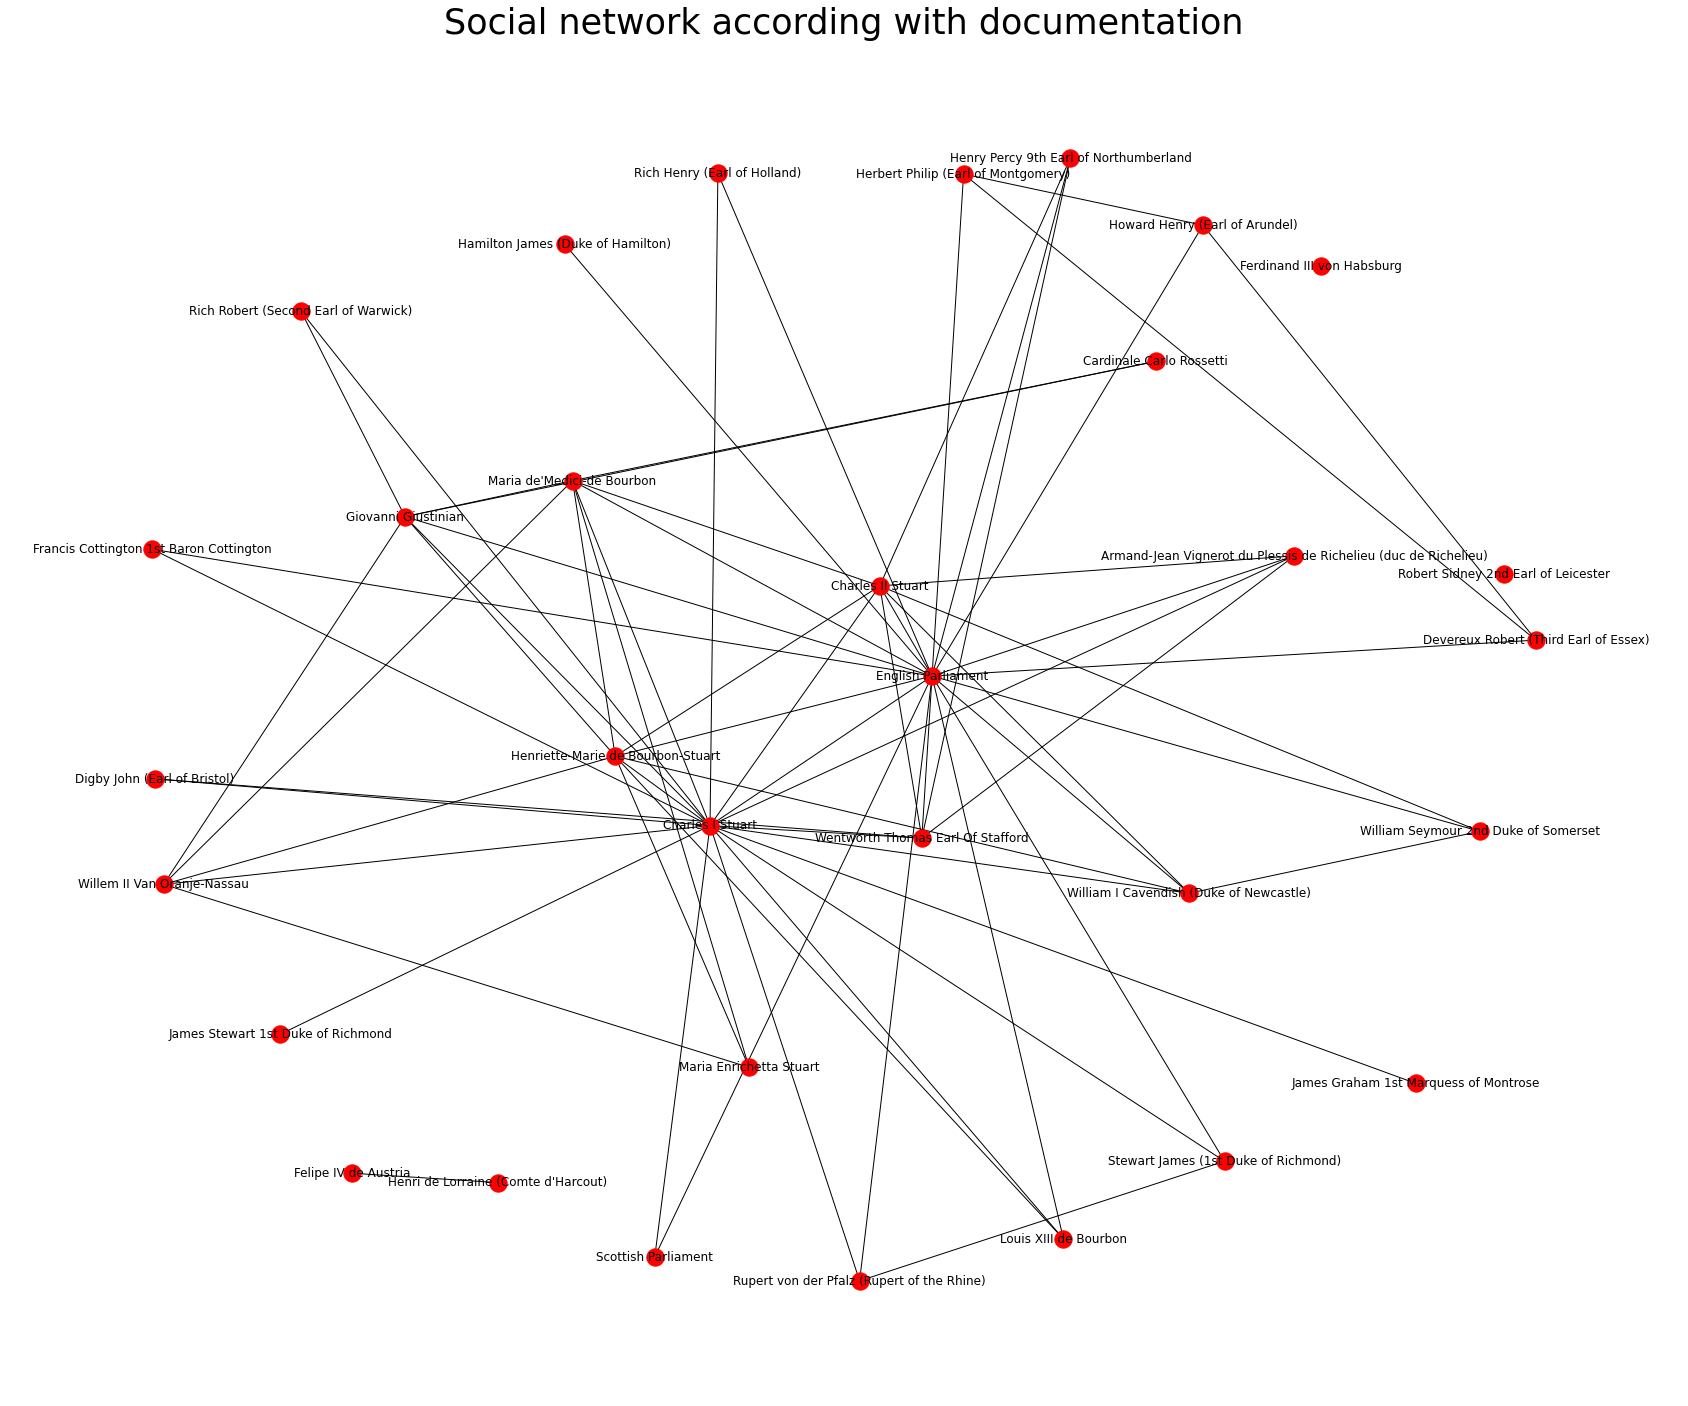
To carry out the actual analysis, a Python script was created that allows us to visualize how all the protagonists are connected to each other within the entire year[2]. The outcome of the analysis unveils a clearly structured network, revealing the presence of actor clusters that anticipate the factions that will arise during the subsequent civil war. Specifically, the analysis demonstrates how the King and the Parliament act as two main hubs, attracting other actors towards them. Furthermore, some of these actors are solely connected to one of the two hubs, while both hubs exhibit a significantly higher number of connections, indicating their crucial role in the network.
This simple graphic representation allows us to anticipate what has been done next, namely a series of analyses dedicated to the social network (fig.1).

The graph illustrates each node as a red circle representing a character, while the edges connecting them are depicted by straight lines. Upon initial inspection, the graph displays variations in the number of links, indicating the importance and recurrence of characters in the documentation. Additionally, there are clusters of characters that are only connected to the network through a single node, which is evident from the partial disconnection.
The first analysis involved measuring the network density, which reflects the level of effective exchange between individual nodes. The density result is expressed as a numerical value, and in this case, it is 0.13709677419354838. The scale ranges from 0 (indicating no connections between nodes) to 1 (indicating perfect connectivity between nodes). Our result indicates low efficiency of connections, which confirms the existence of main nodes serving as the interface for the other nodes to contact the rest of the actors. Despite this, the index is relatively high, suggesting the presence of some well-connected nodes within the network.
The second analysis conducted involved calculating the degree centrality of each node (character) in the network, which measures the number of connections a node has with other nodes. This provides insight into the most important and highly connected characters in the network, and confirms the historical analysis that the King and English Parliament play central roles, with a large number of directly connected nodes (characters). This index ranges from 0 to 1, and for the nodes examined, the King and Parliament had values of 0.61 and 0.65, respectively.
Next, the closeness centrality coefficient of each node (character) was analyzed to determine which nodes have efficient direct connections to others. Once again, the King and Parliament were found to be the most important nodes in the network, with closeness centrality values of 0.67 and 0.69, respectively, on a scale of 0 to 1.
The final analysis performed on the network was the average clustering coefficient, which measures the tendency of nodes to form cliques or clusters. This index ranges from 0 to 1, with a value of 1 indicating a highly clustered network. The result obtained was 0.6447237886382624, indicating a tendency for nodes to form clusters, as visible in the graph. These clusters correspond to micro-factions that are directly connected only to one of the main nodes (King and Parliament), supporting the hypothesis of the creation of royalist and parliamentarian factions.
Further Readings:
D.J. Cohen, Digital history: the raw and the cooked, in Rethinking History Vol. 8, No. 2, Milton Park, 2006, pp. 337-340.
Michael Braddick, God’s Fury, England’s Fire: a new history of English Civil Wars, London, Penguin Global, 2009.
Xiaoming Fu, Jar-Der Luo, Margarete Boos, Social Network Analysis: Interdisciplinary approches and case studies, Boca Raton, CRC Press, 2017.
[1] For an in-depth study of the topic read Xiaoming Fu, Jar-Der Luo, Margarete Boos, Social Network Analysis: Interdisciplinary approches and case studies, Boca Raton, CRC Press, 2017, pp. vii-viii.
[2] The code is available at the link: www.newsfromsalvetti.eu, page accessed on 02/02/2023.